From address
to solar report.
In one Mac app.

Tegrona builds a real 3D model of the roof, lays out the panels, simulates the yield and hands your client a ready PDF — before the coffee gets cold.
Join the beta See how it works Native macOS · Windows planned
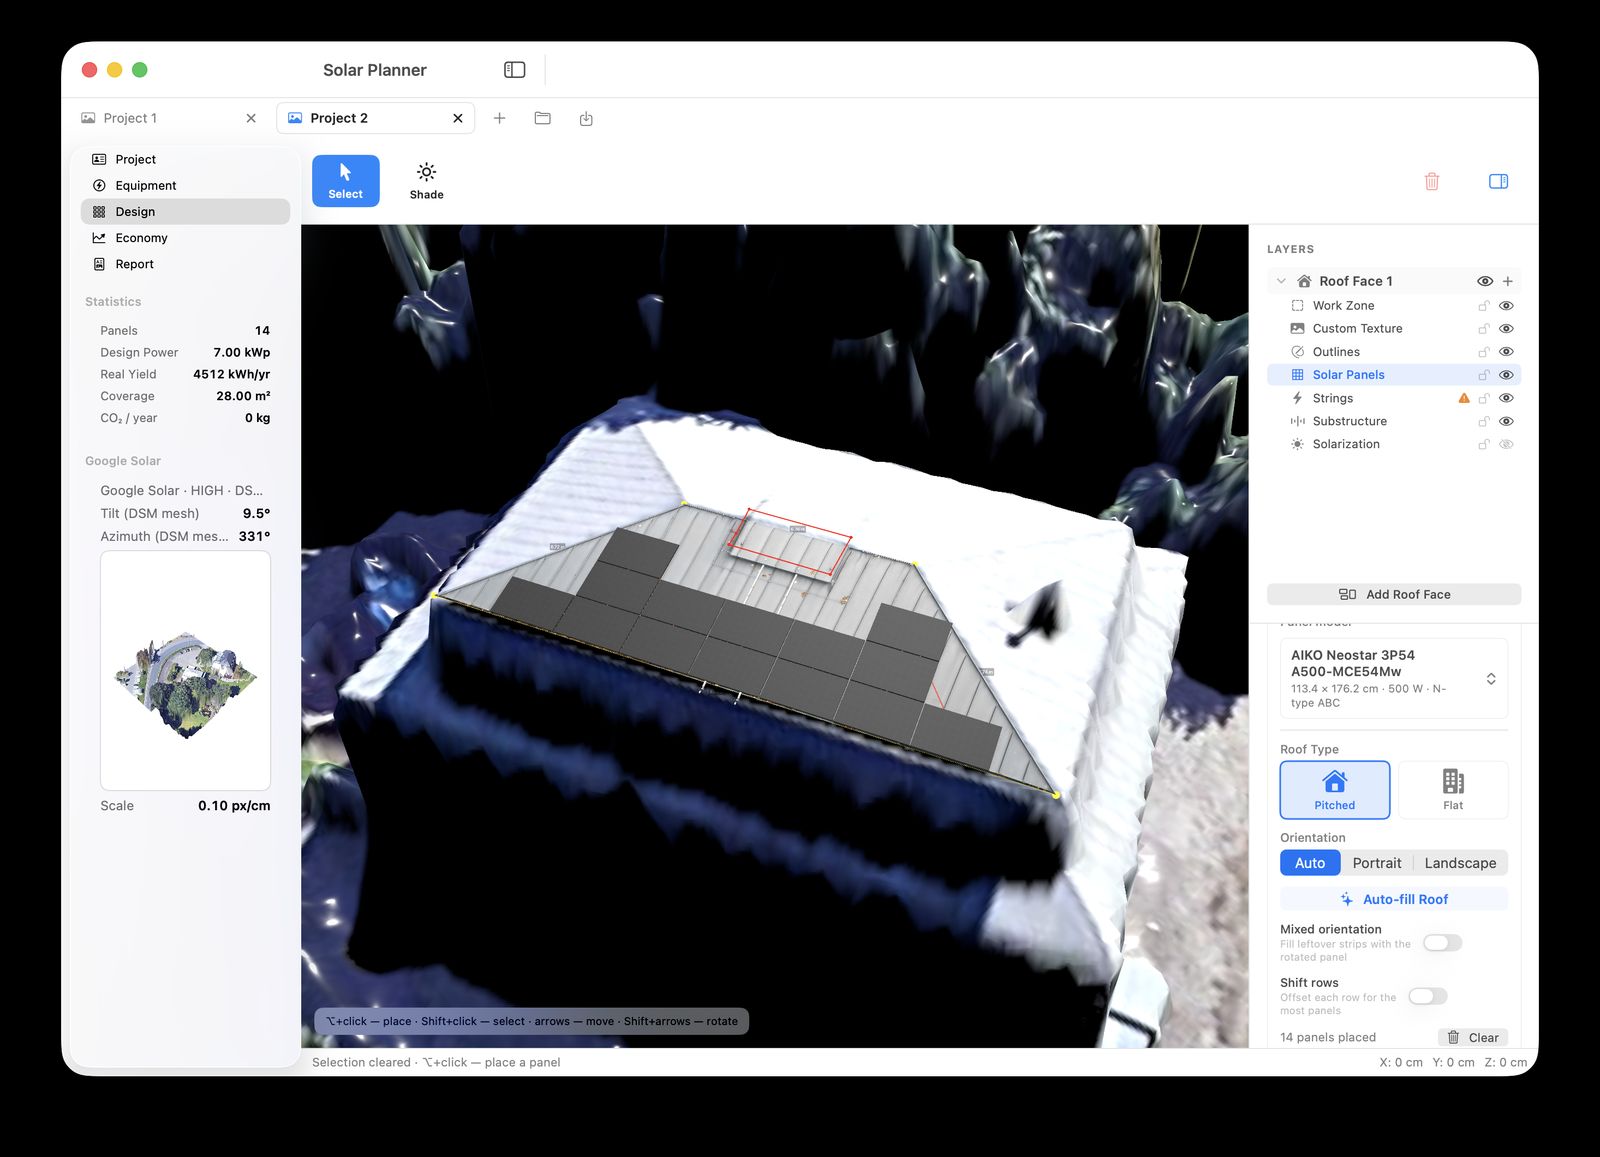
Tegrona — 3D roof model with solar panel layout
Real 3D, not a sketchRoof geometry from Google Solar API DSM mesh — tilt and azimuth detected automatically.
PVGIS yield engineLocation-specific simulation from EU JRC PVGIS with a full loss waterfall.
Engineering-grade outputSingle-line diagram, electrical schematic, BOM export — not just a pretty picture.
Minutes, not hoursAuto-fill the roof, tweak the layout, export. A quote on the same day.
Features

Everything between the rooftop photo and the signed contract

🏠
3D roof in one clickEnter an address — Tegrona pulls the DSM mesh and imagery from Google Solar API and builds the scene. Manual roof faces for anything the satellite missed.
Smart panel layoutAuto-fill with portrait, landscape or mixed orientation, row shifting, work zones and exclusion areas. Every panel remains hand-adjustable.
🗄️
Component databaseReal panels and inverters with datasheet parameters — from AIKO modules to SMA Tripower. Pick a model, the maths follows.
🔌
Strings & substructureString planning, substructure and solarization layers live directly on the 3D model — the electrical design stays connected to the geometry.
📈
Economics that clients trustConsumption, tariffs, feed-in, discount rate, 25-year horizon. Monthly production chart and a transparent loss waterfall from irradiation to AC output.
📄
Client-ready PDF reportAerial overview, system design, single-line diagram (Schaltschema), electrical schematic, BOM as JSON or CSV — export and send.
Workflow

Four steps. One evening to learn.

1
Address → 3D modelGoogle Solar DSM mesh, detected tilt & azimuth, scale-calibrated imagery.
2
Lay out the panelsAuto-fill the roof face or place panels by hand. Work zones keep clearances honest.
3
Simulate the economicsPVGIS yield, self-consumption, tariffs — every assumption editable, everything recalculates.
4
Export the reportPDF with diagrams and BOM. Your client sees a finished project, not a promise.
Inside the app

Built like a design studio, thinks like an engineer

Yield you can defend

The Economy tab runs a PVGIS simulation for the exact location and system: annual and specific yield, performance ratio, shading loss.
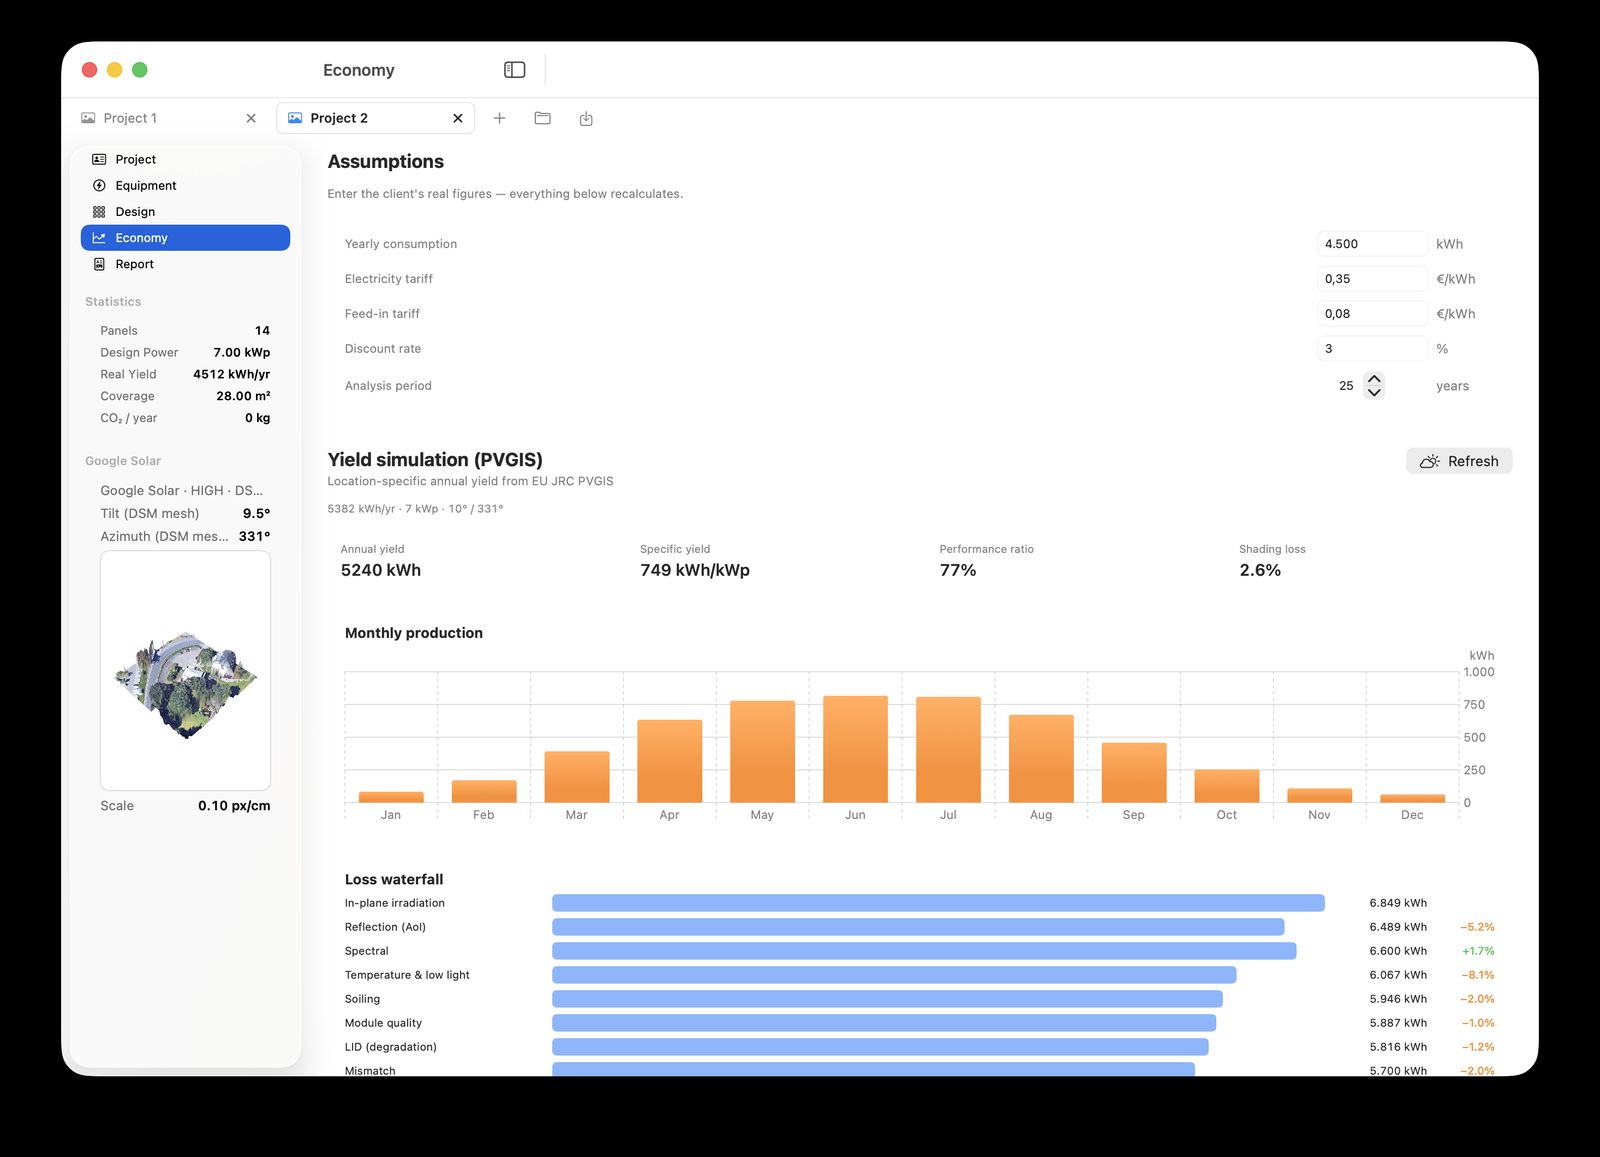
  • Monthly production chart for the client conversation
  • Loss waterfall — reflection, spectral, temperature, soiling, mismatch
  • 25-year analysis with editable tariffs and discount rate
Tegrona — PVGIS yield simulation, monthly production and loss waterfall

The report that closes the deal

One click assembles a client-ready document: project overview with aerial imagery, system design, client data — and the engineering pages installers actually need.
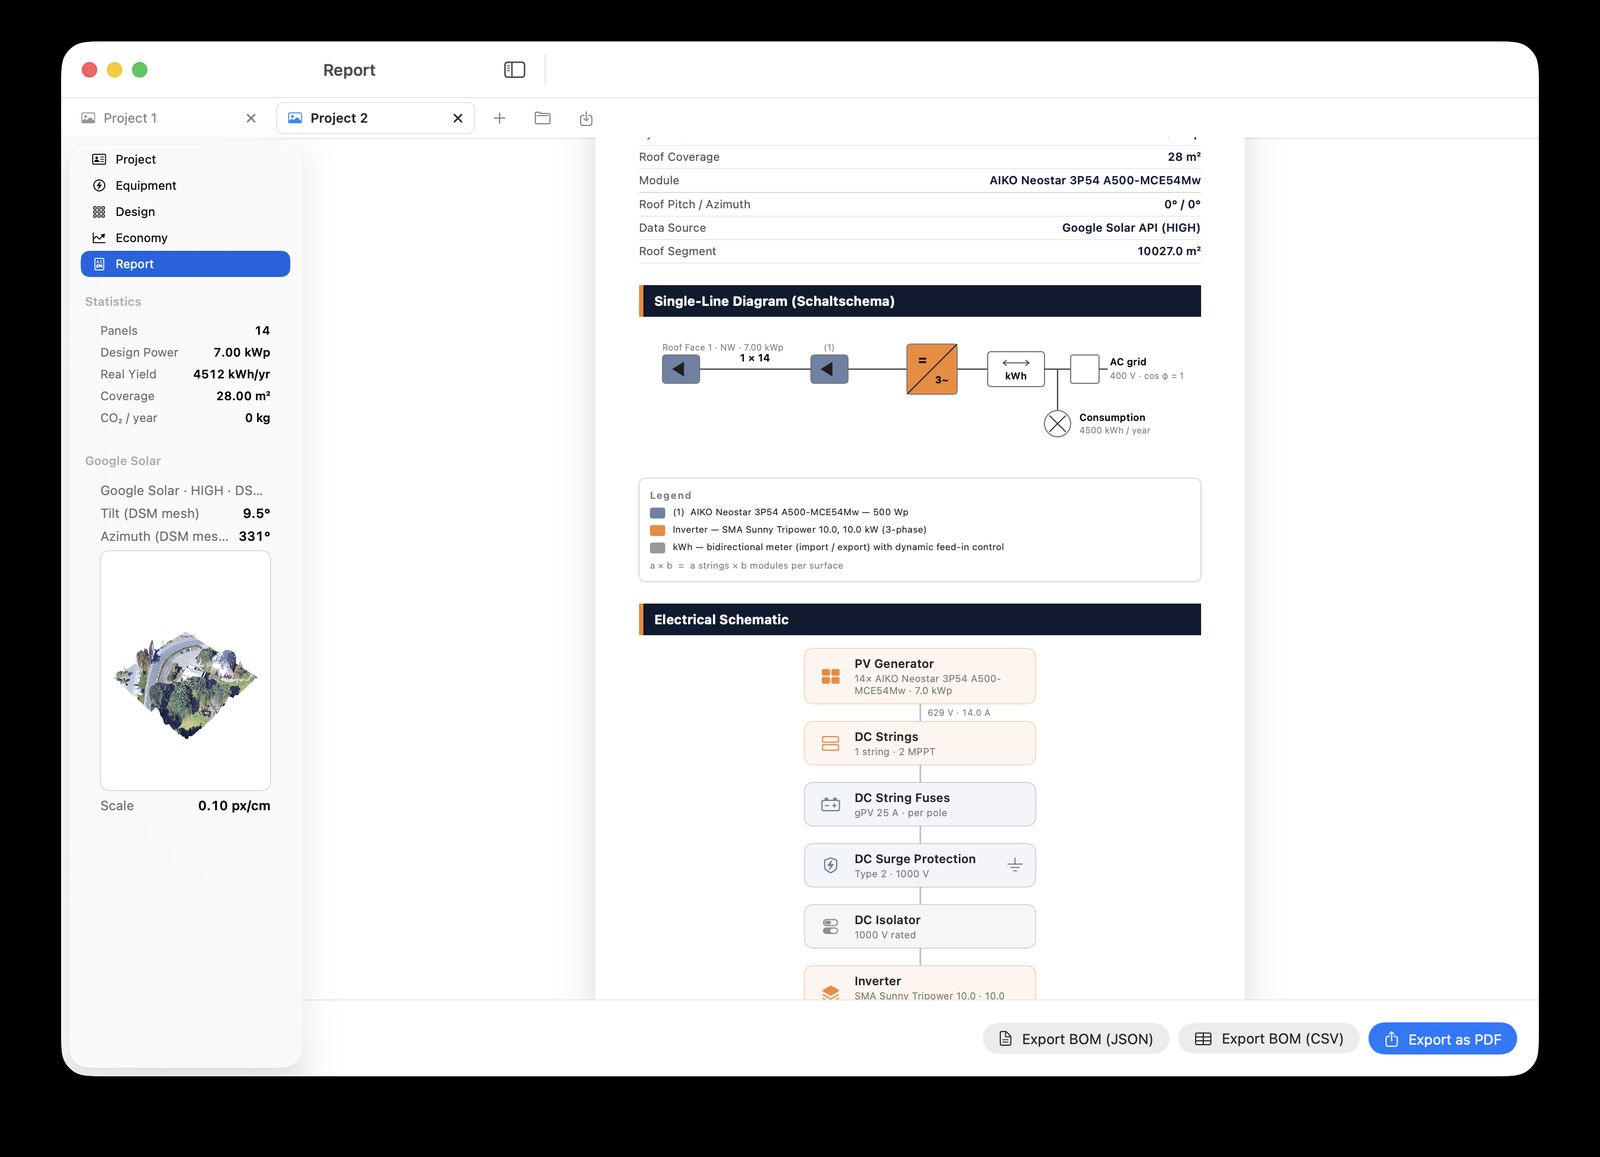
  • Single-line diagram (Schaltschema) with legend
  • Electrical schematic: strings, fuses, surge protection, isolator, inverter
  • BOM export as JSON or CSV for procurement
Tegrona report — single-line diagram and electrical schematic
Compare

Everything you need from the big packages.
Nothing you dread about them.

Legacy PV suites
≈ €1000 every year, per seat
Windows-only, a desktop from 2005
Weeks of training courses
Features you will never open
TEGRONA
Fair license — no yearly ransom
Native macOS · Apple Silicon fast
Productive in one evening
The 95% you use daily, polished
FAQ

Fair questions

Which platforms does Tegrona run on?

Tegrona is a native macOS app, optimized for Apple Silicon. A Windows version is on the roadmap — join the beta list and we'll tell you the moment it lands.

Where does the 3D data come from?

Roof geometry and imagery come from the Google Solar API (DSM mesh with detected tilt and azimuth) where coverage exists. Outside coverage you can model roof faces manually on calibrated imagery.

How accurate is the yield simulation?

Yield is computed with EU JRC PVGIS data for the exact location, panel parameters from the component database and a full loss chain — reflection, spectral, temperature, soiling, module quality, LID and mismatch. Every assumption is visible and editable.

Can I hand the output to an installer or a grid operator?

The PDF report includes the system design, a single-line diagram and an electrical schematic, plus a BOM export in JSON or CSV — designed to be a working document, not marketing material.

What will it cost?

Pricing will be announced at launch. The promise stays simple: no €1000-per-year subscription treadmill. Beta participants get preferential terms.

Beta

Be first on the roof

Leave your email — get the beta build, the launch discount and zero spam.